Statistics
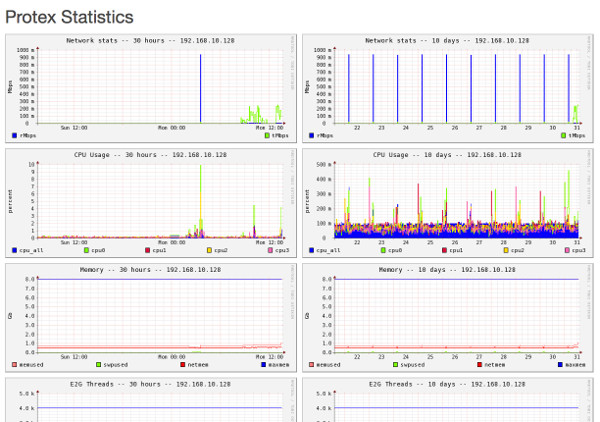
This screen provides an interface for viewing various server statistics. There are two columns of graphs for 30 hours and 10 day output. The parameters logged are:
- CPU %: On systems with multiple cores each is logged as a separate line. The average CPU percent usage is logged as a solid area graph.
- Memeory %:
- maxmem: either the maximum physical RAM or the maximum assigned to a Virtual Machine
- memused: total memory being used
- netmem: total memory less the memory buffers
- swpused: total Swap memory used. This should stay at about zero. A rise much above zero is an indication that more RAM is required.
- Network (Mbps): transmitted (tMbps) and received (rMbps)
- E2G Workers:
- pmax: the maximum number of workers allowed for this amount of RAM
- pchildren: the number of e2g processes currently running
- pinuse: the number of e2g processes actively serving requests
- E2G Worker Births/Deaths: workers serve a limited number of requests before being killed off. New processes are spawned as required. This graph gives some indication of the level of churn.
- Connections: the number of connections per second.